
While I still appreciate the basic premise of the U-curve research, I decided to do some social science sleuthing on my own. I discovered that academics from the London School of Economics and Political Sciences found that happiness peaks at ages 23 and 69. The reasoning seemed logical enough.
At 23, we’ve often put our formal education behind us, we’re making money, and we have some newfound freedoms. At 69, we’ve often put our formal career behind us (as well as family-raising), we hopefully have some money in the bank, and we’re enjoying our freedom again. In addition, we’re no longer chasing someone else’s definition of success or happiness. And the happiest folks who are on the precipice of 70 are often embarking on a new life adventure as opposed to just becoming a “couch potato” or “golf junkie.”
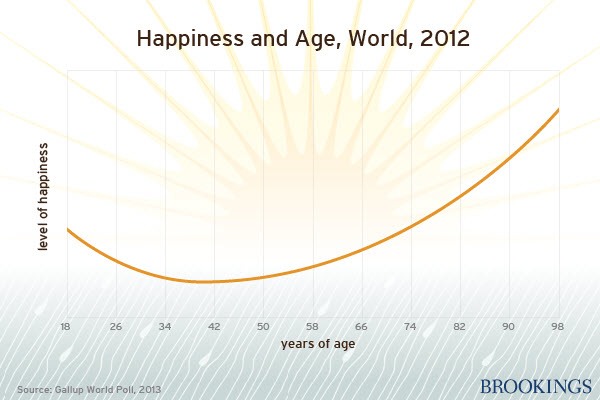
While this Brookings Institute/Gallup World Poll graph suggests the low point might be around age 40, most of the research shows that it’s almost exactly halfway through these twin poles of happiness – around age 46 or 47 – that our life satisfaction hits its bottom.
In sum, just know that 23-year increments—23, 46, 69—seem to be relevant to whether we’re smiling or not. Of course, your mileage may vary.